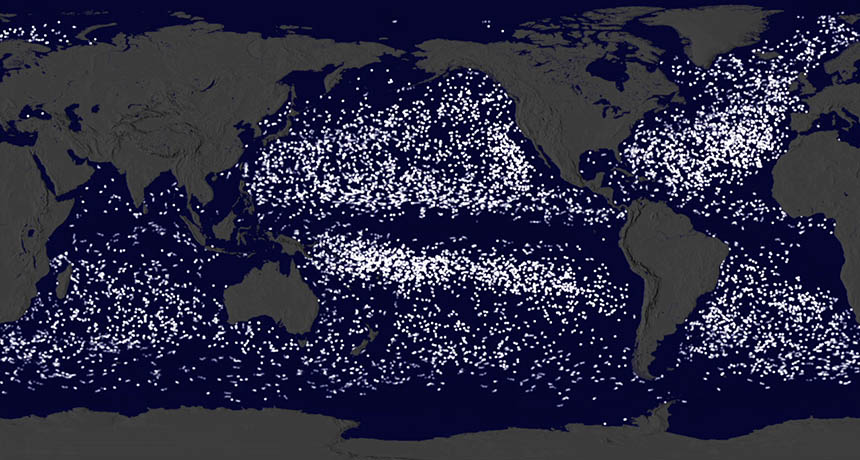
Garbage in, garbage out. But where does all that garbage go? In the oceans, floating bits of debris — everything from plastic bags to Legos — tend to ride along ocean currents to a common destination: one of five major whirling ocean gyres, also known as the ocean garbage patches. Researchers recently got a new look at these gyres thanks to a visualization that combined 35 years’ worth of data on another thing humans drop into the oceans: scientific buoys. The visualization was a finalist in the Data Stories competition sponsored by the American Association for the Advancement of Science. The winners were announced May 5. Free-floating buoys, released by the National Oceanic and Atmospheric Administration, track temperature, saltiness and other ocean properties. Experts at NASA’s Scientific Visualization Studio combined the movements of more than 17,000 buoys to illustrate the motions of the oceans (see animation below). The buoys start off scattered across the oceans, with some in neat lines that follow the paths of buoy-deploying research vessels. From this chaos, the buoys begin to migrate into clusters. Over time, most drop off the grid and disappear, but some buoys eventually end up in one of the ocean garbage patches.
The garbage patches aren’t floating landfills of intact soda bottles and yogurt cups. The gyres are instead speckled with tiny plastic bits smaller than grains of rice, as many as 100,000 per square kilometer. All that plastic can end up in fish and serves as a foundation for microbe colonies (SN: 2/20/16, p. 20).